COMMENTS
|
www.TheCitizensWhoCare.org
|
 The national
economy hadn't added new jobs between December, 2007 and
October, 2009. November, 2009 finally saw 4,000 jobs on the
plus side. Also, average hourly earnings increased in
December, the private sector added jobs for the second month
in a row and temporary jobs, which usually signal a new
hiring phase, increased by 47,000. Don't forget that
December's unusually lousy weather was responsible for at
least some of the job losses in construction. "It took us
two years to lose these jobs. It will take at least that
long to get them back." Over 8 million jobs were shed in
this recession.
The national
economy hadn't added new jobs between December, 2007 and
October, 2009. November, 2009 finally saw 4,000 jobs on the
plus side. Also, average hourly earnings increased in
December, the private sector added jobs for the second month
in a row and temporary jobs, which usually signal a new
hiring phase, increased by 47,000. Don't forget that
December's unusually lousy weather was responsible for at
least some of the job losses in construction. "It took us
two years to lose these jobs. It will take at least that
long to get them back." Over 8 million jobs were shed in
this recession.
Oregon
had 88,300 fewer jobs in 11/09 versus 11/08, 3,900 of those
were government jobs. (Bureau of Labor
Statistics.)
What
is the Oregon legislature doing about meeting future job
needs? The fastest growing occupations for 2008-2010 period,
by number of new jobs:
|
Job
|
New
Jobs
|
% Change
|
Median
wage
|
|
Registered nurse
|
582,000
|
22%
|
$62,450
|
|
Home health aides
|
460,900
|
50%
|
$20,460
|
|
Customer service
reps
|
400,000
|
18%
|
$29,860
|
|
Food service/prep
(1)
|
394,000
|
15%
|
$16,430
|
|
Personal and home
care
|
375,800
|
46%
|
$19,180
|
|
Retail sales
|
375,000
|
8%
|
$20,510
|
|
Office clerks
|
359,000
|
12%
|
$25,320
|
|
Accountants
|
279,000
|
22%
|
$59,430
|
|
Nursing aides
|
276,000
|
19%
|
$23,850
|
|
College teachers
|
257,000
|
15%
|
$58,830
|
Source: Bureau
of Labor Statistics 1-Includes fast food.
Here are 25 contemporary jobs and their current salaries
*
compared with their monetary equivalent 50 years ago**:
|
Job
|
Rank
|
2008
|
1958
|
|
Accountants
|
8
|
$54,440
|
$7,313
|
|
Administrative assistants
|
16
|
$44,471
|
$5,973
|
|
Automotive mechanics
|
20
|
$34,565
|
$4,643
|
|
Chefs
|
9
|
$54,143
|
$7,273
|
|
Construction workers
|
18
|
$36,214
|
$4,864
|
|
Dry cleaners
|
23
|
$22,429
|
$3,013
|
|
Elementary school teachers
|
10
|
$53,020
|
$7,122
|
|
Emergency medical technicians
|
19
|
$35,609
|
$4,783
|
|
Fast food workers
|
25
|
$19,833
|
$2,664
|
|
Firefighters
|
12
|
$52,293
|
$7,024
|
|
Flight attendants
|
6
|
$63,913
|
$8,585
|
|
Grocery store managers
|
7
|
$55,629
|
$7,472
|
|
Commercial painters
|
17
|
$41,120
|
$5,523
|
|
Hospice workers
|
14
|
$46,191
|
$6,204
|
|
Janitors
|
22
|
$25,725
|
$3,455
|
|
Newspaper journalists
|
24
|
$21,963
|
$2,950
|
|
Personal trainers
|
15
|
$46,049
|
$6,185
|
|
Pianists
|
5
|
$64,348
|
$8,643
|
|
Plumbers
|
13
|
$48,591
|
$6,527
|
|
Police officers
|
11
|
$52,801
|
$7,092
|
|
Public relations representative
|
3
|
$72,575
|
$9,748
|
|
Registered nurses
|
4
|
$66,427
|
$8,923
|
|
Sales clerks
|
21
|
$26,844
|
$3,606
|
|
Surgeons
|
1
|
$322,281
|
$43,289
|
|
Veterinarians
|
2
|
$93,685
|
$12,584
|
|
*Salary figures based on data
from CBsalary.com, powered by SalaryExpert.com
**Past salary figures based on data from Marketing
Worth's calculator for relative value of the U.S.
dollar.
|
|
Source: jobs.aol.com/articles/2010/01/22/what-was-your-salary-worth-50-years-ago/?icid=main|htmlws-main-n|dl4|link3|http%3A%2F%2Fjobs.aol.com%2Farticles%2F2010%2F01%2F22%2Fwhat-was-your-salary-worth-50-years-ago%2F
|
Oregon budget shortfall 14.5%. State revenues plummeted 19%
between the first quarter 2008 and the first quarter of
2009, a reflection of Oregon's heavy reliance on income
taxes. Voters have rejected adding a sales tax nine times,
thwarting attempts at creating a new source of state
revenue.
Federal taxes have dropped considerably (-4.6%) in the past
decade for everyone with taxable income over $33,950 while
those making under $8,350 have seen a 10% increase and most
likely aren't able to claim most deductions. And while the
upper bracket pays 35% over $372,950, the way taxes are
actually calculated, they are only paying 30.5% on the first
half million of taxable income (this is after all of the
deductions that the wealthy can find.) The higher the tax
bracket, the larger the percent of disposable income that
they have available to enjoy. (Tax Foundation,
www.taxfoundation.org/publications/show/24834.html,
7/09)
|
Taxable Income Range - Federal
|
2000
|
2002
|
2009
|
Change
2000 to 2009
|
Maximum
Tax
|
Actual %
on Total
|
|
$0 to 8,350
|
0%
|
10%
|
10%
|
+10%
|
$835
|
10.0%
|
|
$8,350 to 33,950
|
15%
|
15%
|
15%
|
No Change
|
$4675
|
13.8%
|
|
$33,950 to 82,250
|
28%
|
27%
|
25%
|
- 3%
|
16750
|
20.0%
|
|
$82,250 to 171,550
|
31%
|
30%
|
28%
|
- 3%
|
41754
|
24.0%
|
|
$171,550 to 372,950
|
36%
|
35%
|
33%
|
-3%
|
108216
|
29.0%
|
|
Over $372,950
|
39.6%
|
38.6%
|
35%
|
-4.6%
|
152684*
|
30.5%
|
* 35% times the amount of taxable income
over $372,950 Used a half-million total income for this
example.
BTW: In 1944, the top income tax
rate was 94% and the lowest tax rate was 23%.
Oregon
would be tied with Hawaii for the highest tax (11%) for the
wealthiest group for two years. After that time, Oregon
would drop to 9.9% while Hawaii would remain at 11%, New
Jersey at 10.75, California at 10.55, and Rhode Island at
9.9%. (Tax Foundation, 7/09)
|
Taxable Income Range - Oregon
|
2008
|
Proposed
2009-2010
|
Change
2008 to 2009
|
Proposed
after 2011
|
Maximum2009
Tax
|
Actual %
on Total
|
|
$0 to 3,050
|
5%
|
5%
|
No Change
|
5%
|
152.50
|
5%
|
|
$3,050 to 7,600
|
7%
|
7%
|
No Change
|
7%
|
471.00
|
6.2%
|
|
$7,600 to 125,000
|
9%
|
9%
|
No Change
|
9%
|
11,037.00
|
8.8%
|
|
$125,000 to 250,000
|
9%
|
10.8%
|
+1.8%
|
9.9%
|
24,537,00
|
9.8%
|
|
Over $250,000
|
9%
|
11%
|
+2%
|
9.9%
|
52,037.00*
|
10.4%
|
*Take 11% times the amount of taxable
income over $250,000. Used a half-million total income for
this example.
Cuts in chemical dependency programs increase medical,
inpatient health care and emergency room costs. With an
outpatient chemical dependency recovery program in place, it
has been shown that total medical costs declined 26%,
inpatient health care costs decline 35% and emergency room
costs decline 39%. (Kaiser Permanente,
Sacramento.)
Underage
drinking in Curry County was above the Oregon average for
8th and 11th graders (past month alcohol use and past month
binge drinking.) (DHS 2006)
The
early onset of alcohol abuse among young people is
inextricably linked to significantly higher rates of drug
abuse. (SAMHSA, 2004)
"Growing
the government" without really "Growing" the Government.
Example: When you cut 15% out of a program and reinstate the
program later at its original budget, it requires a 17.65%
increase in spending. And, that's not adjusted for
inflation, which would be even more.
It appears that the thinking on the other side of the aisle
is - meet inflation with a matching reduction in staff
and/or programs.
As
giving to non-profits drops drastically, they aren't able to
provided many of the services they had been providing for
years. The outcome is either ending those services like
helping run-a-way youth, helping get the homeless back on
their feet, helping drug or alcohol dependent people get
clean and sober, etc. Another alternative is for the city,
county, state or federal government to step in. I would hope
that we as the human race still have a place in our hearts
to support the government agencies to do what we as
individuals are un-willing or un-able to do.
If
66 fails, Oregonians who received the first $2,400 in
unemployment payments would be taxed almost as much as
corporations are being asked to pay in prop 67. I'm sure
most people in this situation could use that $120 a lot more
than most corporations affected by the change.
To
quote Senator Kruse: "Call their bluff. Oregon can't
afford not to." But, I say a vote for 66 and 67 will
call "their" bluff. Cutting programs adds costs to many
areas of the government down the road and negatively impacts
the lives of many Oregonians in the process. Let's not let
that happen.
I'm
thinking that our two representative might have a vested
personal interest in the failure of both of these
proposition and might consider recusing themselves from
further action on these measures.
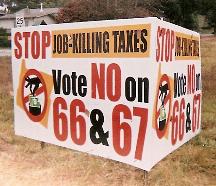
You've
seen this sign. They're all over the state. They probably
each cost more than the $140 increase some corporations are
being askied to pay. It's interesting the spin they did.
"Job-killing taxes" are a scare tactic that holds very
little water when looked at realistically. While, failure of
the passage of 66 and 67 will almost surely require more
personnel cuts. The other graphic I find interesting is in
the bottom left-hand corner showing a hand pulling a bill
out of a wallet. In actuality, for those making less than
$125M, that's your wallet that the wealthy want to pick.
Part
of the thinking about voting against 66 and 67, the
shortfall can be made by requiring government employees to
pick up part of their health coverage. See how it works. The
rich individuals and corporations get richer while the
middle and lower class take the hit. I'm sure most
government employees aren't making anywhere near $125M.
Again, their asking the workers to take the hit and reduce
their disposable income ever more.
What
if... Phil Knight came out in favor of Oregon and in favor
of 66 and 67. What an incredible act of corporate
responsibility. Especially when it appears some legislators
have been using Nike as a scare tactic saying "they are
thinking of moving to Washington and take their 40,000
employees with them." Nike told me that that was absolutely
not true and they only have around 5,300 employees in Oregon
to begin with. A true investment in sustainability,
something I haven't heard much about from either side of the
aisle.
What
if... the next time budget cuts need to be made, the
legislature starts making them in the counties that vote
against tax increases to support those programs. Those
counties are, in effect, saying they don't need all of the
government services they have. Why should counties that want
progress suffer because of the countries that prefer
regressive policies?
Oregon
voters have a chance to decide who they think deserves a
break - and who can pay a little bit more.
Learn
to speak Tea Bag  because other languages are just too
hard.
because other languages are just too
hard.
HOW
OREGON RANKS IN THE U.S.
1st
- tied with Alabama, Montana and New Hampshire for having no
sales tax. Washington has 8.5% and California 8.25%
(Highest) (7/09 State Revenue Departments)
1st
- Smallest growth in State Police compared with the
population growth 1995-2008 (-31%). Only 10 states had a
decline. Next closest was South Carolina -19%
(FBI Uniform Crime Reports, Census Bureau)
1st
- tied with Hawaii for the highest personal tax (11%) for
the wealthiest group for two years. After that time, Oregon
would drop to 9.9% while Hawaii would remain at 11%, New
Jersey at 10.75, California at 10.55, and Rhode Island at
9.9%. (Tax Foundation, 7/09)
2nd
highest minimum wage ($8.40). Washington is highest at 8.55
and California is 4th with 8.00.
3rd
- highest retailer violation rates on tobacco sales to
minors. (Substance Abuse and Mental Health Services
Administration)
4th
for illicit drug dependence among 18-25 year olds. (NSDUH,
2002)
4th
with most students (3,142) per school nurse. Washington is
25th with 1,060 and California 40th with 2,240. Hawaii has
no RNs, Utah 4,893 students per and Michigan 4,204 students
per. (Low number is better.) (National Association of School
Nurses)
7th
lowest state beer tax (.0839 per gallon.) California is
29th at .20, Washington is 34th lowest at .261 and Alaska is
the highest at $1.07/gallon. (As of 1/04 CSPI and the
Federation of Tax Administrators.)
7th
for illicit drug abuse in persons 12 and older. (NSDUH,
2002)
8th
lowest job loss 4th Quarter 2008 to 4th Qtr 2009 at -1.0% or
17,737 jobs. Washington was 2nd with -0.2% and California at
-1.9%. (Moody's economy.com)
8th
highest level of foreclosures in 2009 vs. 2008.
Washington17th and California 24th. In regard to total
disclusures, Oregon ranked 21st with 34,121 closures,
Washington 19th with 35,268 and California 1st 632,573
closures. (Ideal is largest ranking
number.) (Source:RealtyTrac. in UST Today
1/14/10.)
9th
highest shortfall of the 50 states - 14.5%
10th.
Oregon is tied with Illinois with the largest percentage of
workers who were members of a union in 2008. (16.6%)
California had 18.4% and Washington had 19.8%. Yet Oregon
has one of the highest unemployment rates in the nation.
(Bureau of Labor Statistics)
12th
smallest decrease (-8%) in traffic fatalities 2008 vs 2007.
Washington down 11%, California no data.
13th
lowest obesity rate at 24.2% of Oregonians. Washington tied
at 24th with 25.4% obese and california ranked 10th with
23.7% obese. (CDC 2008)
14th
highest percent (76.6%) of foreclosure 3rd Quarter 2009 vs.
3rd Quarter 2008. Washington at 33% and California at 18.6%.
(Low percent better.)
15th
largest population growth from 2008 to 2009 adding 42,666
new people. California was 18th and Washington was 7th.
Percent change 2000-2009 was up 11.8% or 404,220 people
representing the 13th best growth during that period.
(Census Bureau)
18th
in percentage with fewer than two inspections of school
cafeterias during 2006-07 and 2007-08 school years. Federal
law requires two inspections a year. Washington was 28th
with 24.4% not in compliance and California was 45th with
57.2% not complying. Average in the U.S. was 29.5%.
(USA Today analysis of U.S. Department of Agriculture
data.)
20th
highest % of low-income children (41% of the children in the
state.) (Annie V. Casey Foundation)
22nd
state with "America's Best High Schools" Of 299 high
schools, 31 or 10.4% achieved a Bronze or better award and
7, or 2.3% received a Silver or Gold, Washington was 21st
and California 4th. Low number is better. US News and
World Report
23rd
most obese state with 26.3% of our people rated obese. We
are tied with Maryland. California has 23.3% obesity and
Washington at 25.9%. (CDC 2007)
29th
lowest gas tax at .25. California is .399 and Washington is
.375.(American Petroleum Institute
38th
of 42 States Tap Water Quality Base. High number is
good.
44th
highest unemployment (11/09) at 11.1%. California 47th at
12.3% and Washington is 32 at 9.2%. Oregon had the 39th
highest unemployment for 2007 and 2008.
(www.bls.gov/web/laumstrk.htmat)
45th for
access to Addiction Treatment. (OMHAS, 2004)
49th for
access to Addiction Treatment among 18-25 year olds. (OMHAS,
2004)
Read
More Here
|
©2010,
www.TheCitizensWhoCare.org/comments.html
|
|